
Data + question mapping
A practical inventory of sources, definitions, owners, gaps, and the business questions each report should answer.
Business intelligence
Connected dashboards, reporting workflows, and data tools that replace manual reconciliation with information people can actually act on.
The opportunity
Most teams already have plenty of data. The harder problem is that it lives in separate tools, uses inconsistent definitions, or takes hours of cleanup before anyone trusts it. We begin with the decisions the business needs to make and trace the information required to support them.
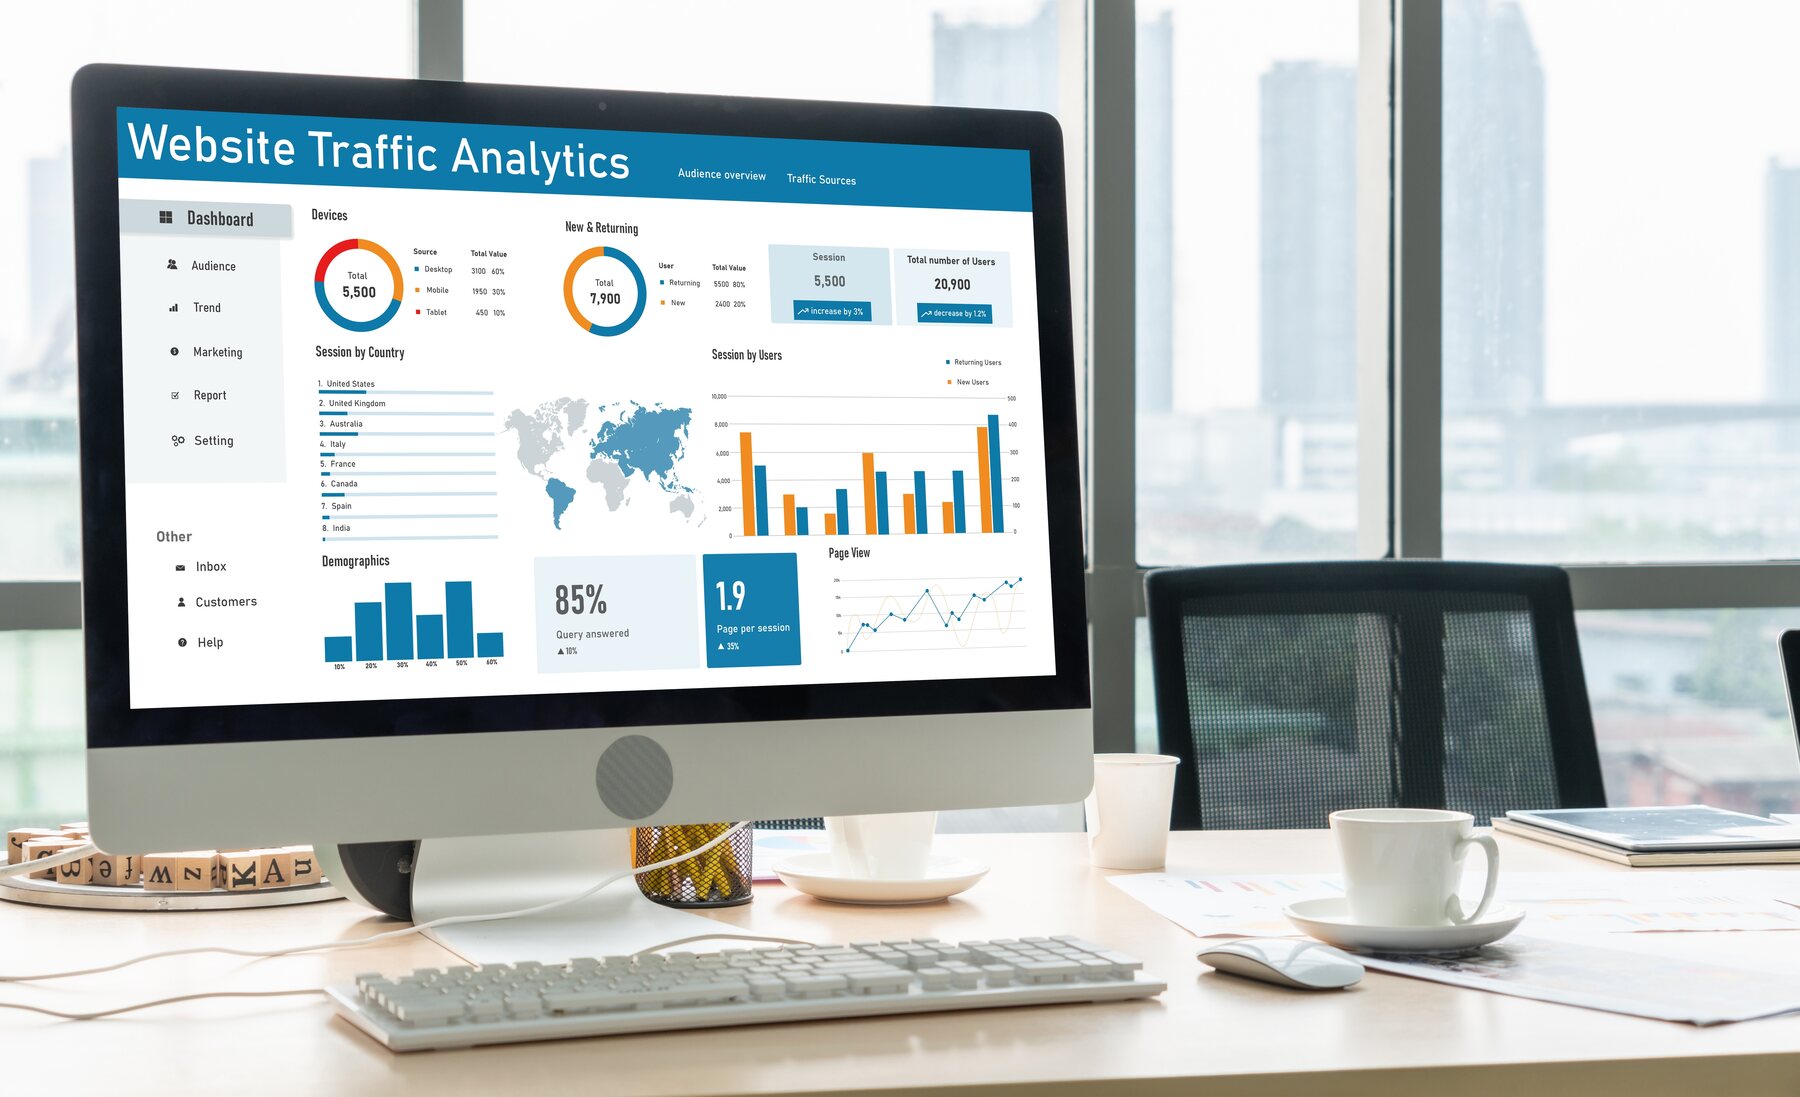
From there, we can connect sources, establish dependable calculations, and build dashboards or scheduled reports around the people using them. The goal is not more charts. It is a shared view of what is happening and what deserves attention next.
What the work can include
A practical inventory of sources, definitions, owners, gaps, and the business questions each report should answer.
Imports, APIs, scheduled jobs, validation, and transformation that make information consistent enough to trust.
Role-aware views, filters, summaries, alerts, and exports designed around recurring decisions.
Clear ownership, quality checks, documentation, and refinements based on how the reporting is actually used.
Related work
Common questions
Usually. We assess available APIs, exports, database access, data quality, and update frequency before recommending the right integration approach.
Not always. A focused reporting layer may be enough for a smaller operation. We recommend additional infrastructure only when the volume, history, governance, or number of sources genuinely requires it.
Yes. Dashboards, scheduled summaries, exception alerts, and recurring exports can reduce manual reporting while keeping the underlying definitions visible.
A practical next step
We can help clarify the opportunity, identify the expensive unknowns, and shape a build that fits the business.
Start a conversation